Information inside the dashboard can be filtered / viewed in many ways.
At the top right of the dashboard you can choose the two primary filters (client and log display)
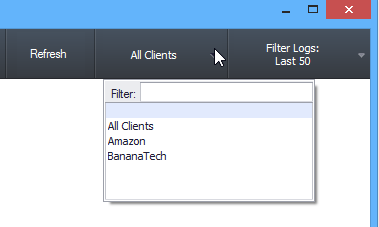
Choosing a client will load only the ESET data relevant for endpoints belonging to that particular client.
Choosing "All Clients" will show the data for all clients that the logged in LabTech user has permissions to view.
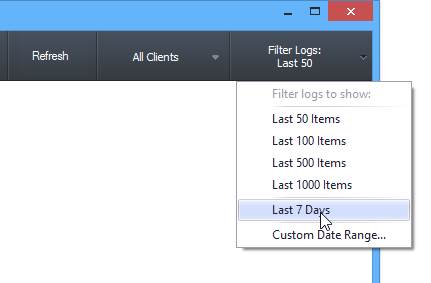
The Filter Logs option will set the maximum number of logs to load / display.
Selecting "Last 1000 Items" for example will load the last 1000 threats, scans, and tasks.
Choosing Last 7 days or a custom date range will load all information for the selected dates.
All tables in the dashboard can be filtered and sorted by any column
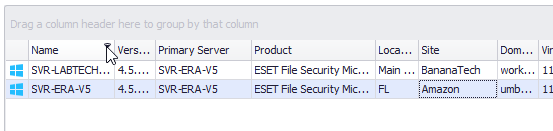
Hover over a column to display the filter icon, clicking this will bring up a range of options.
Example: How to find all endpoints with "Server" in the name
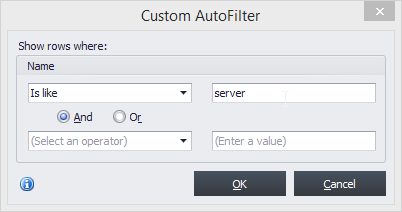
This will force the table to hide all irrelevant data.
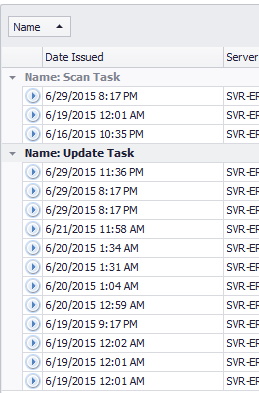
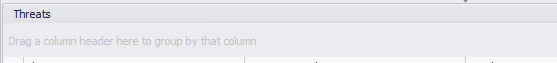
Many tables in the plug-in allow "Grouping" to allow another method of viewing data quickly.
Tables that allow grouping will display a "Group box" above the table with the caption "Drag a column header here to group by that column"
To group by a column, drag any column into the Group Box and drop it.
The table will update instantly with the results
Example - Grouping the task log by Task Name