Overview Module
*All data is filtered based on the client and log filters on the top right of the dashboard windows*
The overview module displays a dashboard of high-level information.
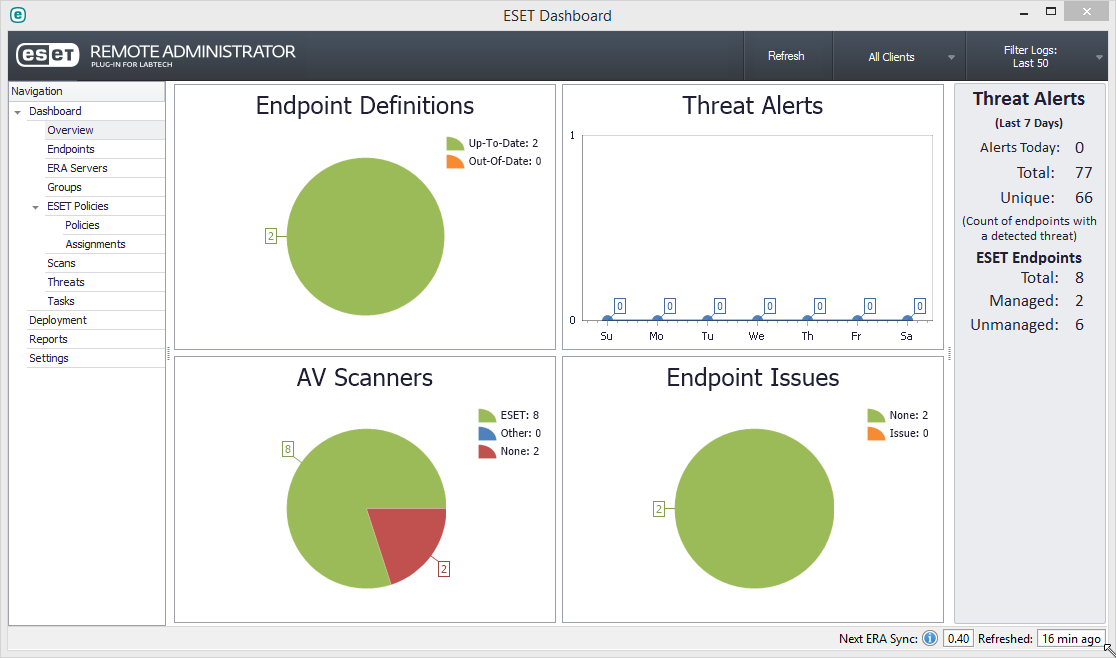
Charts:
- Endpoint definitions: Displays a pie chart showing how many endpoints have up-to-date AV definitions (green) and out-of-date (orange)
- Threat Alerts: This is a line graph showing how many endpoints have been flagged with threats in the previous week.
- AV Scanners: Uses the LabTech AV Scanners information to display which endpoints use ESET, other AV, or report no scanner.
- Endpoint Issues: Anything that shows up with an orange/red indicator on the endpoint tab would count as an issue. This can be out-of-date definitions, not checking in for a while, out-of-date system patches, disabled protection, uncleaned threats, etc.
Details Panel:
Threat Alerts: (Last 7 days)
- Alerts Today: Number of endpoints that flagged threats today.
- Total: Total threats for all endpoints.
- Unique: Total unique threats. IE: 3 machines having the same threat = 1 unique.
ESET Endpoints:
**(Uses role detection added from the plugin, numbers may not match AV scanners until all agents run their LabTech inventory updates)
- Total: Total detected ESET installations.
- Managed: Total endpoints that are manageable inside the plugin.
- Unmanaged: Total endpoints minus the managed endpoints. This can be used to identify endpoints that haven’t matched up correctly or endpoints connecting to an ERA server that hasn't been configured in the plug-in.